Pause and inspect a Python program
Py Editor for Mac · Developer ID 27.0.2 (32) · reviewed with Helper 0.5.3
A breakpoint pauses a program at a chosen source line. Use the paused state to inspect its stack and values before continuing. The main walkthrough uses your editable AI Vision Lab copy with its environment and dependencies prepared.
Before starting
Save the source file and check the selected run configuration before debugging.
The walkthrough uses Current Selected File with main.py selected. Debugging
executes the program: continuing AI Vision Lab can train its model and write its
report, just as a normal run does. Setting a breakpoint itself does not edit the
Python source. If you only want a short calculation with no report generation,
use the small restart exercise.
Check which debugger interface actually opens. An initial session on this
reviewed build displayed the visual debugger, but later starts reported
Invalid run request and opened the interactive pdb fallback. The cause was
not established; these are not interchangeable results.
| What you see after starting | Which instructions to follow |
|---|---|
| A paused state with structured Call Stack and Variables | The visual walkthrough below: evaluate, step over and continue. |
Visual debugger unavailable (Invalid run request); using interactive pdb. and a (Pdb) console |
Go to the fallback workflow. Do not wait for the visual stack controls to appear. |
| No paused session and no usable fallback | Read the actual error and check project settings; the successful sessions here do not establish a fix for every startup failure. |
Keep unrelated breakpoints. Before toggling an exercise breakpoint, check Bookmarks for that exact file and line: toggling an existing breakpoint removes it. After the exercise, remove only breakpoints you added.
Set a breakpoint and start
- Select main.py in the AI example.
- In Structure, select split_dataset(). Check that the cursor reaches line 27 in this example; do not assume the line number matches an edited copy.
- If no breakpoint is already present there, choose Run → Toggle Breakpoint → Toggle Line Breakpoint.
- Click Debug active configuration, the bug icon in the top toolbar.
- For the visual workflow, wait for Paused · breakpoint in the Debug panel. If the app reports fallback instead, use the linked workflow above.
- Read the selected Call Stack entry.
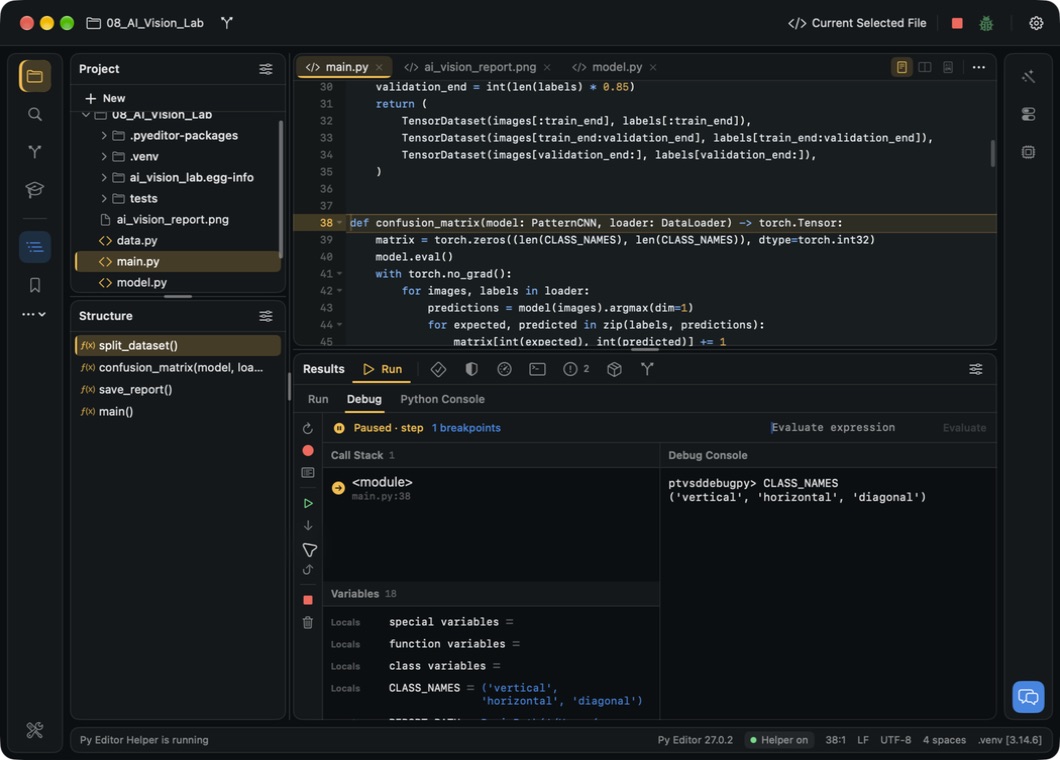
In the verified run, the stack contained <module>, main.py:27, and the panel
showed one breakpoint. The program is defining the function at this point; it
has not yet entered the function body or created its local datasets.
Evaluate a value
- Click Evaluate expression while paused.
- Enter
CLASS_NAMES. - Click Evaluate.
- Read the result in Debug Console.
The observed result was ('vertical', 'horizontal', 'diagonal'). The Variables
area also showed values available in the selected frame. Evaluating expressions
can execute Python code: use simple read-only expressions when you only want to
inspect state.
Advance one statement
- Click Step over, the right-arrow debugger control.
- Wait for Paused · step.
- Compare the highlighted source line and the stack entry.
 Open the screenshot to view it at full size.
The verified step moved from the function definition at line 27 to the next
definition at line 38. It did not enter split_dataset. A step follows executable
statements, not every physical line of source. The image shows the top portion
of Variables, not a complete list of all frame values.
Continue and remove the breakpoint
- Click Continue to let the program run.
- Wait for the session to finish or reach another breakpoint.
- Click the breakpoint count, or Show breakpoints, to open the list in Bookmarks.
- Find main.py · Breakpoint · 27:1.
- Click the close control on that specific entry to remove the test breakpoint.
- Check that this entry is gone. If it was your only breakpoint, the debugger now reports 0 breakpoints; keep any other entries you need.
The reviewed Continue action changed the state to Running, then returned to Debugger ready with Quit disabled. This establishes that the session ended; that final view did not display a program exit code. Removing the one breakpoint left the example without documentation-test breakpoints.
Removing a breakpoint changes where execution pauses. It does not delete the corresponding source line. Never remove other breakpoints just to reproduce a manual image.
Manage breakpoints without starting a session
You can prepare or remove line breakpoints while the debugger is stopped. Open Bookmarks in the Left panel, then use its Breakpoint button to toggle a breakpoint at the current editor line. Check the cursor's line number first: this button acts on the editor cursor, not a selected Bookmarks row.
For a small practice file, use vision_debug_steps.py from the restart exercise
below. Select images_per_class in Structure to reach line 4, then open
Bookmarks and click Breakpoint. The list gains
vision_debug_steps.py · Breakpoint · 4:1. Clicking Breakpoint again while
the cursor is still on line 4 removes that entry. To remove a particular entry
regardless of cursor position, use the close control beside that row.
Click a breakpoint row to return to its source. In the reviewed ACE editor,
switching from model.py through the line-4 breakpoint opened the right file
but initially left the cursor at 1:1. Clicking the same row once more, with
the target file already active, reached 4:1. Check the cursor position and
use this second click if needed. This navigation does not run the program.
The toggle and row-close checks left a pre-existing line-11 breakpoint untouched. Remove only the entry you created for this exercise; an empty list is not the goal when you already have other breakpoints.
When the app falls back to interactive pdb
In a later review session, the app reported Visual debugger unavailable
(Invalid run request); using interactive pdb. The Debug tab then displayed
a (Pdb) command console instead of the earlier structured stack/Variables view.
This fallback is a different interface; its successful tests do not establish
that every visual-debugger feature works.
The cause of the visual startup failure was not established. The example could still be stepped through using the fallback. Do not restart or reinstall Helper solely because this message appears without checking the rest of the session. The same message also appeared with a short, standard-library-only calculation; the review did not establish that AI Vision Lab's dependencies caused it.
Enter and leave a function
- Place a breakpoint on the call to
split_dataset()inmain(), line 115 in this bundled example. Check the cursor line before toggling the breakpoint. - Start debugging and wait for Paused · main.py:115.
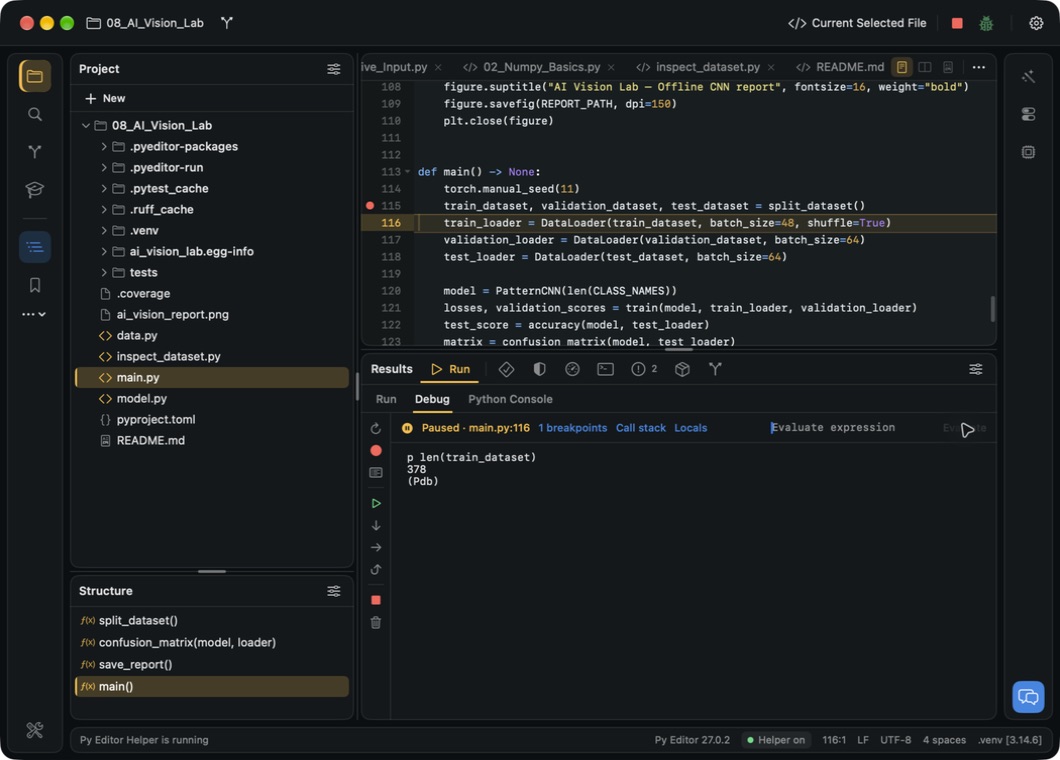
- Click Step into. In the reviewed fallback, it paused at the
split_datasetdefinition on line 27. - Click Step out. The console reported a return event and paused on line 31, the function's return statement.
- Click Step over to reach the caller's next statement, line 116.
- Enter
len(train_dataset)in Evaluate expression. - Click Evaluate and read
378in the console.
Step out can stop at a return event before the caller's next line. Read the current location and console output instead of assuming every click must land on the line after the function call.
 Open the screenshot to view it at full size.
The console was cleared before evaluating the short expression for this capture, so earlier startup messages and personal paths are not shown. Clear debugger output cleared the text without ending the paused session.
Run to a selected line
While paused in this fallback, position the editor cursor at an executable line in the same file. Choose Run → Debugging Actions → Run to Cursor, then wait for the paused location to update. This resumes execution; it is not just an editor navigation command.
The verified case started paused at main.py:1, selected the split_dataset
definition at line 27 through Structure, and reached Paused · main.py:27.
The console showed until 27. This check does not establish cross-file behavior
or the visual debugger's Run to Cursor behavior.
Stop the fallback session
Click Quit debugger to stop a suspended session. Both tested fallback sessions returned to Debugger ready and disabled Quit. Remove only your test breakpoints afterward; 0 breakpoints confirms their removal, not a successful completion of the program's training run.
Restart a paused fallback session
Restart begins a new execution; it does not resume the paused call. Code before your breakpoint runs again, including any file writes or other side effects. Use this small calculation to try it without those effects. Save it as vision_debug_steps.py in an already prepared Python project:
"""Follow a small vision-dataset calculation in the debugger."""


def images_per_class(class_count, total_images):
    per_class = total_images // class_count
    return per_class


class_count = 3
total_images = 540
per_class = images_per_class(class_count, total_images)
print(f"Vision dataset: {class_count} classes, {per_class} images each")
- Place the cursor on the function call at line 11, beginning
per_class =. - Choose Run → Toggle Breakpoint → Toggle Line Breakpoint.
- Click Debug active configuration and wait for the breakpoint.
- In the reviewed
pdbfallback, click Step into. The location becomes Paused · vision_debug_steps.py:4, at the function's call event. - Click Start or restart debugger, the circular-arrow control in Debug.
- Wait for Paused · vision_debug_steps.py:11 again.
In this check, the old Python process ended and a new process stopped at the original breakpoint before calling the function. The previous call at line 4 was not continued. The breakpoint survived the restart. This result applies to the fallback, not the structured visual debugger or arbitrary background tasks.
To finish the exercise, click Quit debugger, then remove only vision_debug_steps.py · Breakpoint · 11:1 from Bookmarks. The reviewed session returned to Debugger ready with Quit disabled; removing its entry left 0 breakpoints. Keep any unrelated breakpoints in your own project.
Starting from an already stopped state was also verified with the same Start or restart debugger control.
Additional controls and boundaries
If you cannot find a breakpoint condition field
The procedures in this chapter use ordinary line breakpoints. In the reviewed
ACE editor, right-clicking the line-number margin showed Reload and
AutoFill, not a condition editor. Neither command sets a breakpoint condition.
Use the verified line-breakpoint and Evaluate expression steps above when
you need to stop and inspect a value. A conditional-breakpoint workflow has not
been verified for this configuration; do not assume a condition will filter
pauses in the pdb fallback.
Other debugger controls
The panel also exposes Step into, Step out, Quit debugger, Start or restart debugger, and Clear debugger output. The Run menu includes Run to Cursor, Resume Program and Evaluate Expression… under Debugging Actions. Step into/out, Run to Cursor, Quit and output clearing were checked only in the fallback described above. Their structured visual-debugger equivalents and conditional breakpoints remain under review. The successful Step over test at the start of this chapter does not cover them automatically.
If debugging cannot start, read its actual error and check the selected project's interpreter and configuration. A connected Helper is a prerequisite in this reviewed environment, not proof that every possible debug target is ready.