Test, measure coverage and profile an example
Py Editor for Mac · Developer ID 27.0.2 (32) · review started 15 September 2026
Use the bundled AI Vision Lab to distinguish three questions: do its tests pass, which lines do those tests execute, and where does the program spend time?
Before starting, prepare a copy of the example as described in Helper and project environments. These procedures were verified with Helper 0.5.3 and the project .venv. The failure tutorial changes one expected value temporarily and restores it afterward; no app-wide settings or original bundled source were changed.
Run the tests
- Open 08_AI_Vision_Lab.
- Click Tests in the Results dock.
- Click Run project tests in the empty panel, or Run when a previous result is present.
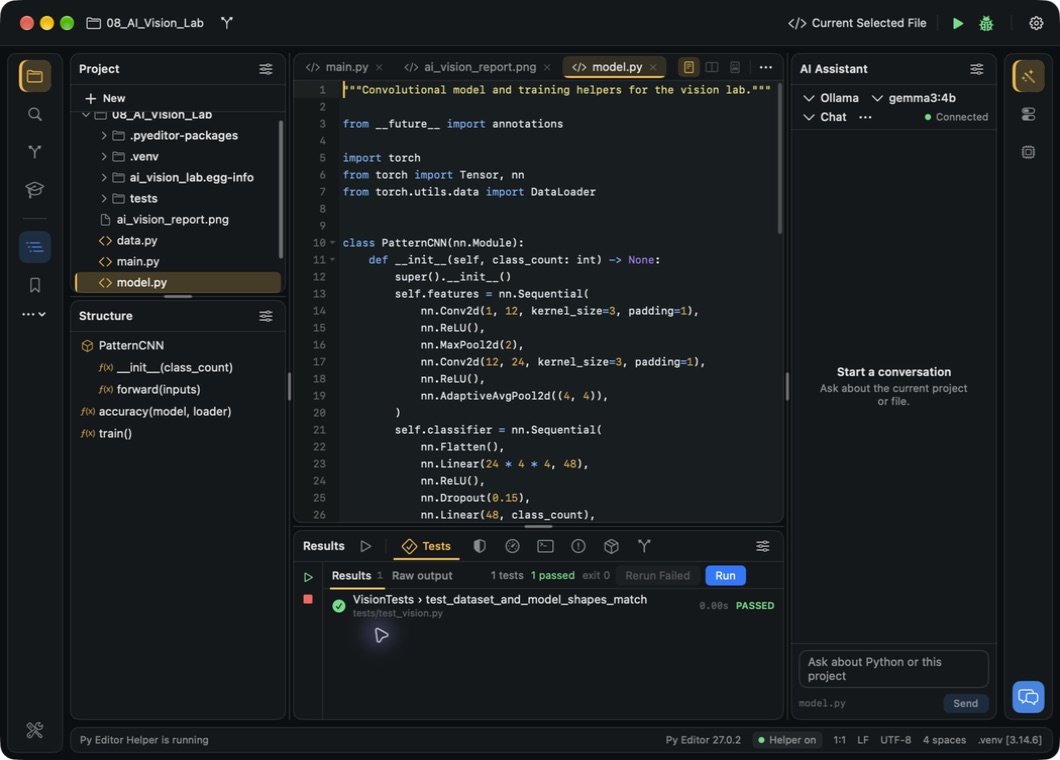
- Read the summary and the individual test row on the Results tab.
 Open the screenshot to view it at full size.
The original example, before adding the companion tests below, produced 1 tests · 1 passed · exit 0. Its named test is VisionTests › test_dataset_and_model_shapes_match. A green result confirms that test passed; it does not prove that every training, file-output or GUI behavior has been tested.
Raw output is available beside Results. Rerun Failed is disabled when there are no failed tests. The next tutorial shows how to inspect a failure and rerun after correcting it.
The Run → Test History submenu does not open a separate history browser in this build. Choose Open Tests to return to the current Tests surface without starting pytest. Choose Run Project Tests only when you intend to start a new project test run. In the reviewed no-result check, Open Tests selected Tests → Results, displayed 0 tests and the current project-setup message, and performed no run. Previously displayed result rows can remain after subset reruns, as explained below, but that is not a browsable archive of past sessions.
Understand a failing test and rerun it
This short exercise deliberately makes the example's expected output shape wrong. Use your tutorial copy, not a project with unsaved work. The model produces three class scores for each image; expecting four should fail without changing the model.
Expand tests in Project and open test_vision.py.
Find the assertion on line 21:
self.assertEqual(tuple(scores.shape), (6, 3))Change only the final
3to4, then save with Command-S.Open Tests in Results and click Run.
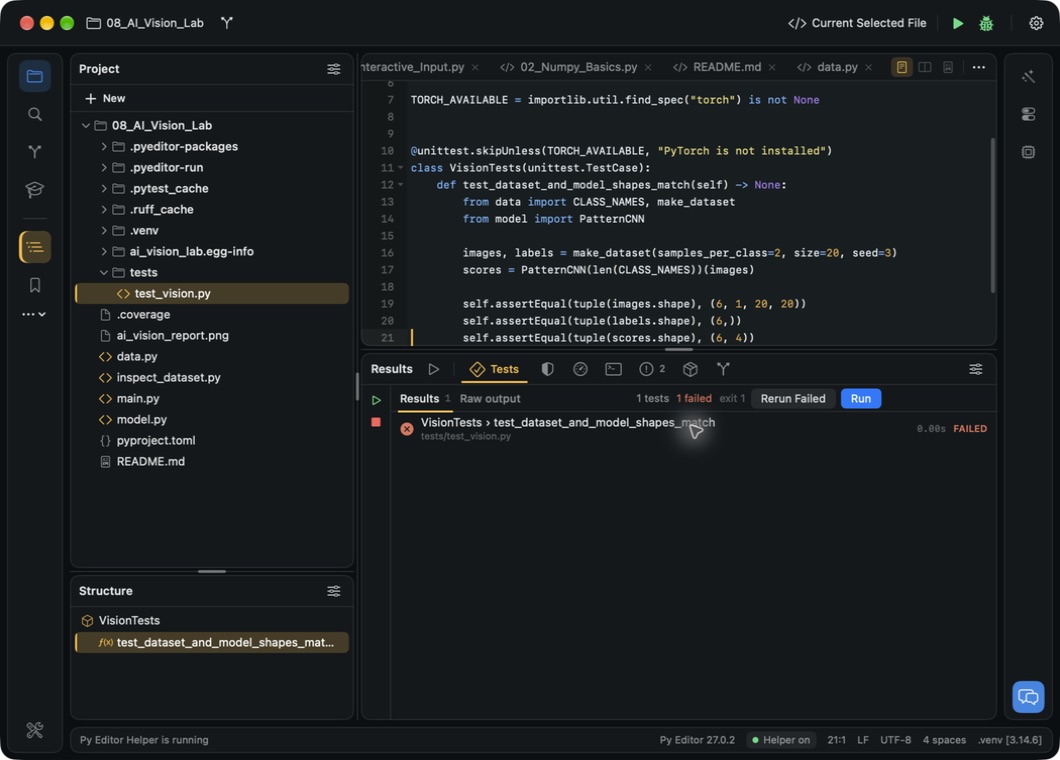
Read 1 tests · 1 failed · exit 1 and the red FAILED row.
Click the failed test row. In the reviewed session, with this file already open, the cursor moved to the failing assertion at 21:1.
Open Raw output to read the reason:
AssertionError: Tuples differ: (6, 3) != (6, 4)
 Open the screenshot to view it at full size.
The first tuple is the actual output shape; the second is the expectation you changed. Six images still have three class scores each. For this exercise, the test expectation is wrong—not the model.
- Restore the expected shape to
(6, 3)and save. - Return to Results and click Rerun Failed.
- Confirm 1 tests · 1 passed · exit 0. Rerun Failed becomes disabled again.
Raw output confirmed that this rerun selected the previous one failure. This proves the single-test recovery flow. The next exercise checks selection behavior in a suite with mixed results. In a real failure, investigate whether the implementation or the expectation is wrong; do not change an expectation merely to make a test green. Raw output can contain personal filesystem paths, so review it before sharing.
Rerun failures in a mixed suite
This exercise adds two small checks alongside the example's original test. It uses the real bundled dataset and the project's existing dependencies. Work in your editable AI Vision Lab copy; the companion file is not part of the original bundled example.
Choose File → New File… and confirm the destination is 08_AI_Vision_Lab.
Create
test_manual_dataset.pybesidedata.py. If it already exists, use an unused name that still starts withtest_, such astest_manual_dataset_2.py, and substitute that filename when reading the test paths below. Enter and save this code:"""Check the bundled dataset; used for the manual test-runner exercise.""" from data import CLASS_NAMES, make_dataset def test_class_count(): assert len(CLASS_NAMES) == 3 def test_total_images(): _, labels = make_dataset() assert len(labels) == 540Temporarily change only the last expectation from
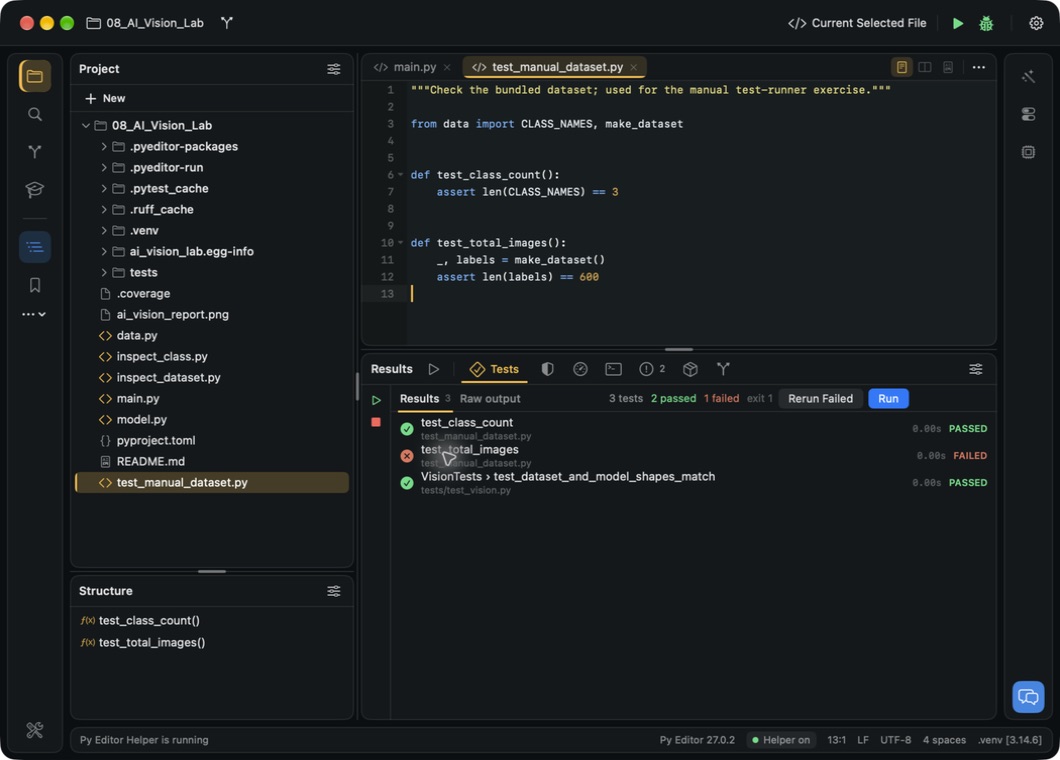
540to600, then save.In Tests, click Run. The reviewed suite reported 3 tests · 2 passed · 1 failed · exit 1. The new
test_total_imagesrow was the failure; the other new test and the original shape test passed.
 Open the screenshot to view it at full size.
- Before correcting it, click Rerun Failed, then open Raw output. Only
test_total_imagesruns again and still fails: the actual count is540, while the temporary expectation is600. - Restore
540in the source and save. - Return to Results and click Rerun Failed again. The failed row becomes green and that button becomes disabled.
- Inspect Raw output: it reports one collected test and 1 passed, even though the Results summary now says 3 tests · 3 passed · exit 0.
- Click Run to execute the whole project suite. This time Raw output lists all three tests and reports 3 passed.
Read the summary and the latest execution separately
Results keeps the other test rows when you rerun a subset. Its total is not necessarily the number executed by the most recent command.
| Action in this exercise | Results summary | Latest Raw output |
|---|---|---|
| Run with the wrong expectation | 3 tests, 2 passed, 1 failed | Three tests executed |
| Rerun Failed before correction | 3 tests, 2 passed, 1 failed | One test executed and failed |
| Rerun Failed after correction | 3 tests, 3 passed | One test executed and passed |
| Run the whole corrected suite | 3 tests, 3 passed | Three tests executed and passed |
Use Run when you need a fresh result for the entire suite, especially after
changing shared code. A preserved green row does not mean that test ran again.
This exercise leaves the companion file with the correct 540 expectation and
does not change the original tests/test_vision.py.
Run one named test
- In Results, right-click the
test_class_countrow. - Choose Run test_class_count.
- Open Raw output and check the collected test name and count.
The reviewed command collected only test_manual_dataset.py::test_class_count
and reported 1 passed. The other two green rows remained in Results, just as
with Rerun Failed. A final full Run then confirmed all three tests passed.
Choose a project check
Use Run → Project Actions for checks across the open project, rather than running only the selected Python file.
- Save the files you want to check.
- Choose the required command from Run → Project Actions.
- Read the new result in the Bottom area shown below.
| Command | Purpose and result location | Reviewed result in AI Vision Lab |
|---|---|---|
| Compile Project | Check Python compilation across the project; output in Run. This is not a distributable-app builder. | Compile Project completed without output. This does not prove the program's runtime behavior. |
| Run Tests | Execute the project's tests; this menu route writes its text report to Run. Use the separate Tests panel for result rows and Rerun Failed. | Collected one test and reported 1 passed. |
| Ruff Check | Request a project code check, distinct from formatting the open buffer. | Requested installation of Ruff in the active project environment; the check did not run. |
| Mypy Check | Request a project type check. | Requested installation of Mypy in the active project environment; the check did not run. |
| Analyze Project | Open the Problems analysis view. | Displayed the two diagnostics described below. |
If Ruff or Mypy is missing, inspect the active interpreter and its packages. A successful Reformat Code command does not establish that project-wide Ruff Check is ready: the reviewed app could format with bundled Ruff while this project check still requested a package in the environment. No Ruff or Mypy installation was performed during this review.
Read the new task message, not just the Run footer. In this session, the footer retained Process finished · 0.7s during different task results, including a missing-tool message and a running test. It was not reliable evidence of the current task's success or duration.
Project Settings → Tasks lists arguments for these tools. The reviewed build
did save and redisplay a custom Test value. However, Run → Project Actions
→ Run Tests did not honor a deliberately nonmatching filter: with
-k no_such_manual_case_8742 saved, it still collected and passed all three
tests. The field was restored to its default empty value afterward.
Treat custom Project Task Arguments as unreliable in Developer ID 27.0.2 (32). Read the collected tests in the new output instead of assuming the saved filter was applied. This finding concerns the Project Actions route; it does not change the separate verified Tests-panel selection and Rerun Failed procedures.
Measure coverage
The report below was captured with the original single-test example, before the mixed-suite companion was added. Additional tests or source files can change its numbers; do not expect the same percentage after expanding the exercise.
Choose Run → Manage Coverage Reports… when you want to return to Coverage without starting a new run. Despite its name in this build, the command selects the Coverage tool in Results; it does not open a separate report archive or manager. If the current project has no report or is not ready, the panel explains what it needs instead. In a separate Mac Desktop Studio no-report check, it showed Coverage needs project setup, disabled Run and Show Coverage in Editor, and offered Install Dependencies and Open Packages. Resolve the stated prerequisite, then run coverage deliberately; merely opening this menu item does not collect coverage or prove that an older report exists.
- Click Coverage in the Results dock.
- Click Run coverage, or Run when the panel already has a report.
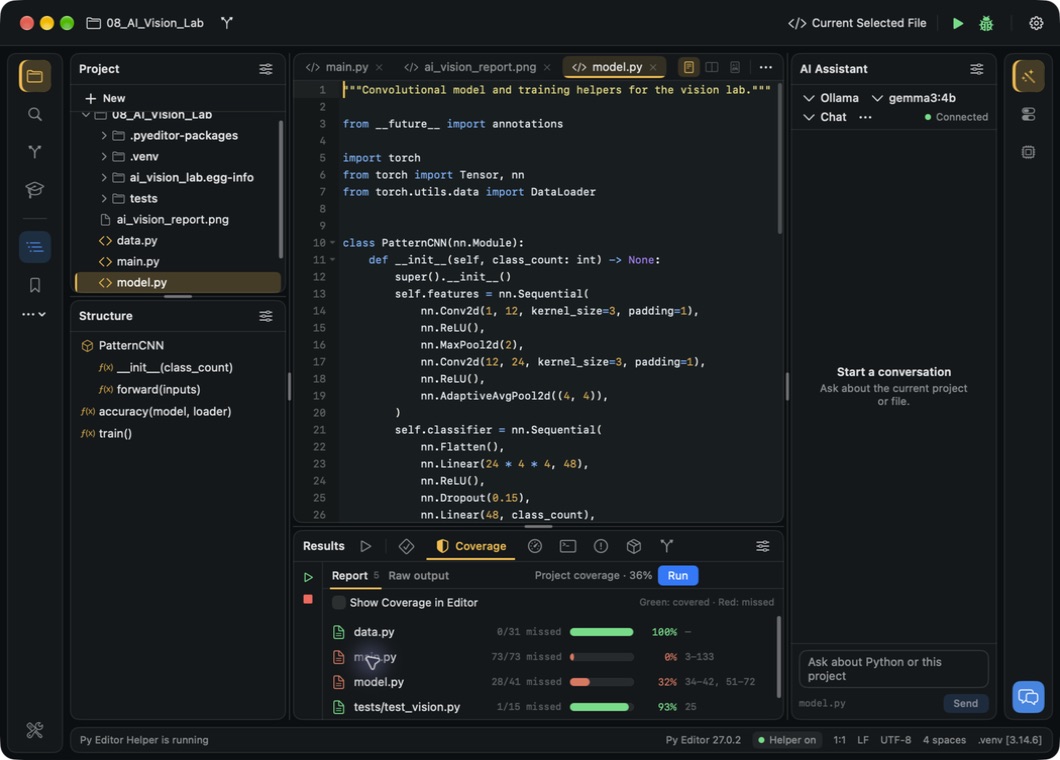
- Read Report for the total and per-file results.
 Open the screenshot to view it at full size.
This run reports 36% project coverage. data.py is fully covered, while main.py is not covered by the test run. That can coexist with a passing test: this particular test checks dataset/model shapes rather than executing the complete program.
Each row shows missed versus total statements, a percentage, and the missing line numbers. Raw output shows both the test run and its coverage table; use it to check which tests actually ran.
Find code that your tests did not execute
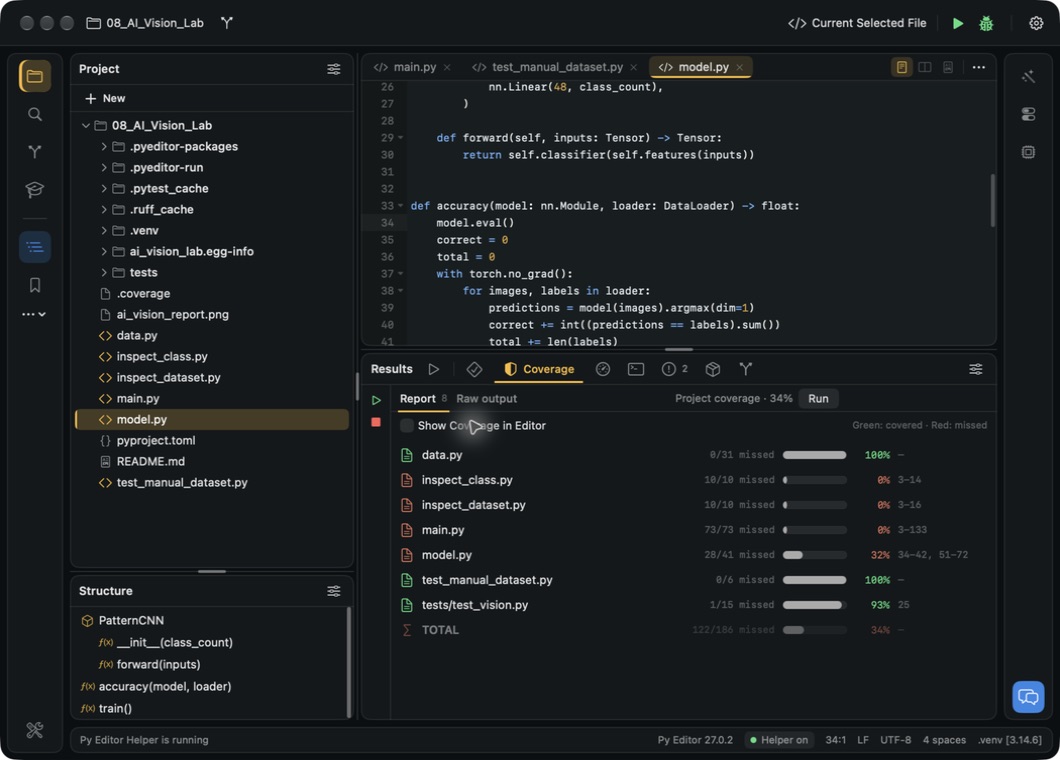
After adding the manual's two companion tests and inspector scripts, a fresh run collected three passing tests and reported 34% coverage: 122 of 186 statements missed. The changed total includes the added scripts; it is not evidence that the original test became worse.
- Open Report and locate a file with missed statements.
- Click its row. In this review, the first click on model.py opened the file at line 1. Clicking the same row again moved the cursor to 34:1, the first missing line listed in the report.
- Read the surrounding function and decide which behavior a new test should exercise. The report identifies unexecuted lines, not necessarily faulty code.
- Run coverage again after changing tests or source; the previous report does not automatically prove coverage of your new changes.
 Open the screenshot to view it at full size.
Show Coverage in Editor becomes available once a report exists. Its legend promises green for covered lines and red for missed lines. In the reviewed ACE editor, checking it did not visibly add those colors, including after a fresh coverage run with the file already open. The checkbox was returned to its original off state. Use the report's missing-line list in this build; colored editor highlighting is not a verified workflow here. This does not establish how another editor engine or app version behaves.
Do not compare the coverage percentage to the model's classification accuracy. Coverage measures executed program statements; the model's accuracy measures predictions against labels.
Profile the program
Profiling executes the configured program with Python cProfile. Although the profiler does not rewrite your source, the program still performs its normal actions: AI Vision Lab trains its model and can regenerate its report. Prepare the example's dependencies first and keep any report you need before starting. Do not profile code with unwanted side effects just to inspect its timing.
- Select main.py and check the active run configuration.
- Open Profiler in the Results dock.
- Click Profile active configuration, or Run for a subsequent session.
- Wait for Call statistics to show results.
 Open the screenshot to view it at full size.
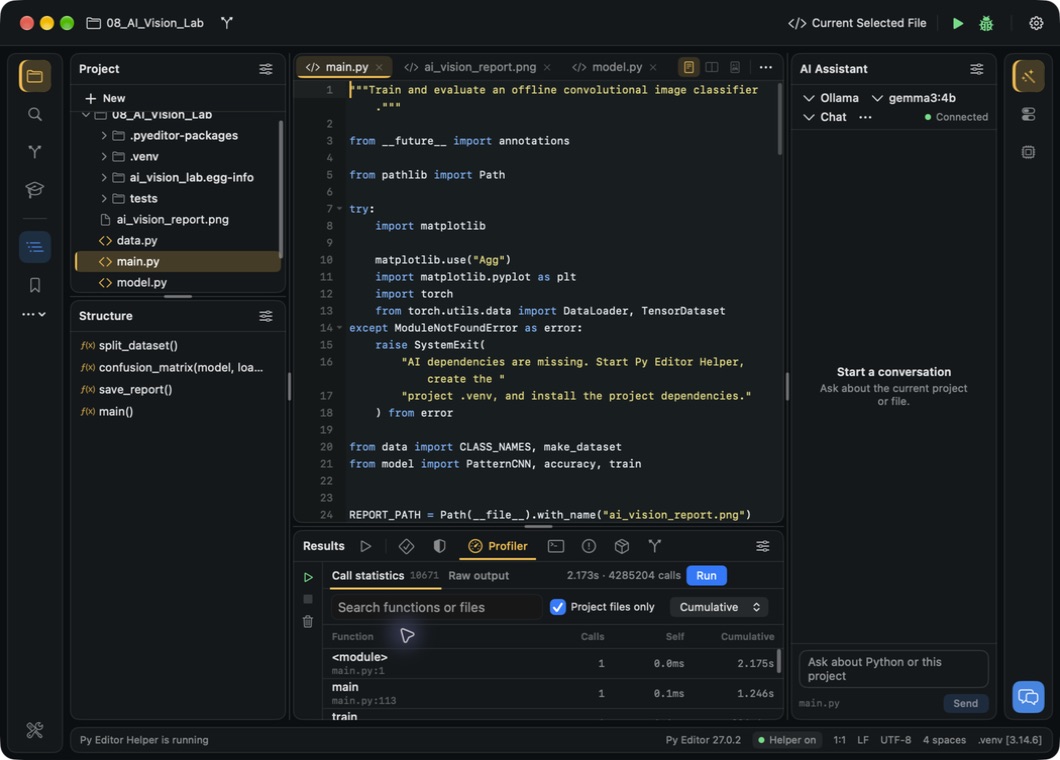
The reviewed session showed approximately 2.17 seconds and 4.29 million calls. These are measurements of that run on the review Mac, not a promised duration. Timing varies, including with imports and caches.
| Column or control | How to use it |
|---|---|
| Function | Identify the call and its file/line. |
| Calls | How often the function was called. |
| Self | Time spent in that function excluding its called functions. |
| Cumulative | Time including functions called from it. |
| Search functions or files | Narrow the visible rows; entering train was verified. |
| Project files only | Restricts the table to project-local paths. The reviewed table still included .venv files inside the project, so this does not mean only your handwritten source. |
| Sort | Choose Cumulative, Self time, or Calls, each largest first. The procedure below compares all three. |
| Raw output | Read the profiled program's output. In AI Vision Lab this included the ten training epochs, final accuracy, confusion matrix and report location. |
A slow cumulative time suggests where to investigate; it does not alone identify an incorrect algorithm. Compare repeated, equivalent runs before drawing conclusions about an optimization.
Compare frequent calls with expensive calls
These controls work on an existing profile; changing the filter or sort does not require running the program again.
- Enter
model.pyin Search functions or files. - Read each row's path. This search also matched
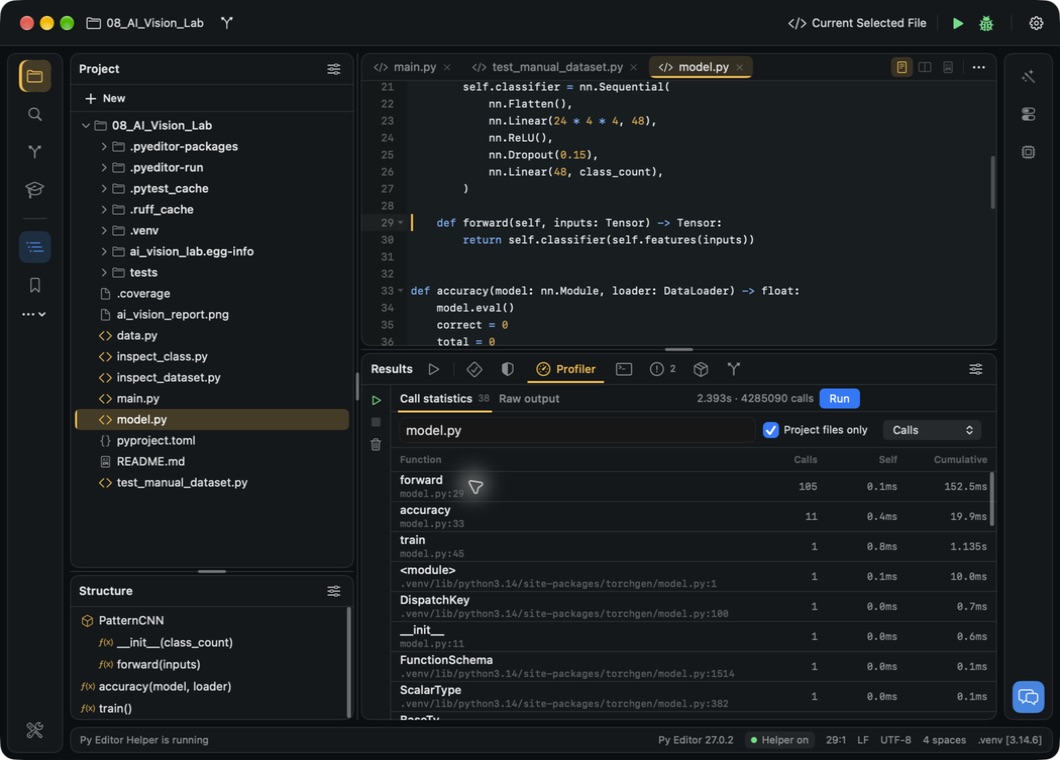
torchgen/model.pyinside.venv, not just the example's own file. - Choose Calls from Sort. In the illustrated run,
forwardappeared first with 105 calls, followed byaccuracywith 11 andtrainwith 1. - Choose Self time to compare time spent directly inside each function.
The same run placed
trainbeforeaccuracy, thenforward. - Choose Cumulative to include work done by called functions. The order
became
train,forward, thenaccuracy.
 Open the screenshot to view it at full size.
The illustrated run reported 2.393 seconds and 4,285,090 calls in its header. These are session measurements, not guaranteed performance. A frequently called function need not have the largest self time; its work may happen in functions that it calls.
Open a function and adjust the filter
Double-click a project-local row to inspect its source. In the reviewed session,
double-clicking forward switched from main.py to model.py at line 1. A second
double-click on that row moved the cursor to 29:1, matching the displayed
model.py:29. Check the cursor position rather than assuming the first switch
reached the requested line.
A search with no matches leaves an empty table and a 0 count beside Call statistics; the session summary remains. Replace or clear the query to see results again—you do not need to rerun the program.
To include runtime calls, clear Project files only. With the search
built-in, the reviewed table was empty while that checkbox was on, then showed
functions such as builtins.len when it was off. Turn it back on to return to
project-local paths. Remember that a .venv inside the project is still included
by this filter. Do not assume every runtime row can open a source file.
Stop a profile and try again
Use the batch-preview script
for this check. It prints twelve progress messages and pauses between them; it
does not generate a dataset or change files. Select run_progress.py and use
the current-file run configuration before starting.
- Open Profiler in the Bottom Results area.
- Click Profile active configuration, or Run if a session already exists.
- While Profiling the active run configuration… is displayed, click Stop.
- Read the output and confirm that Run becomes available again.
 Open the screenshot to view it at full size.
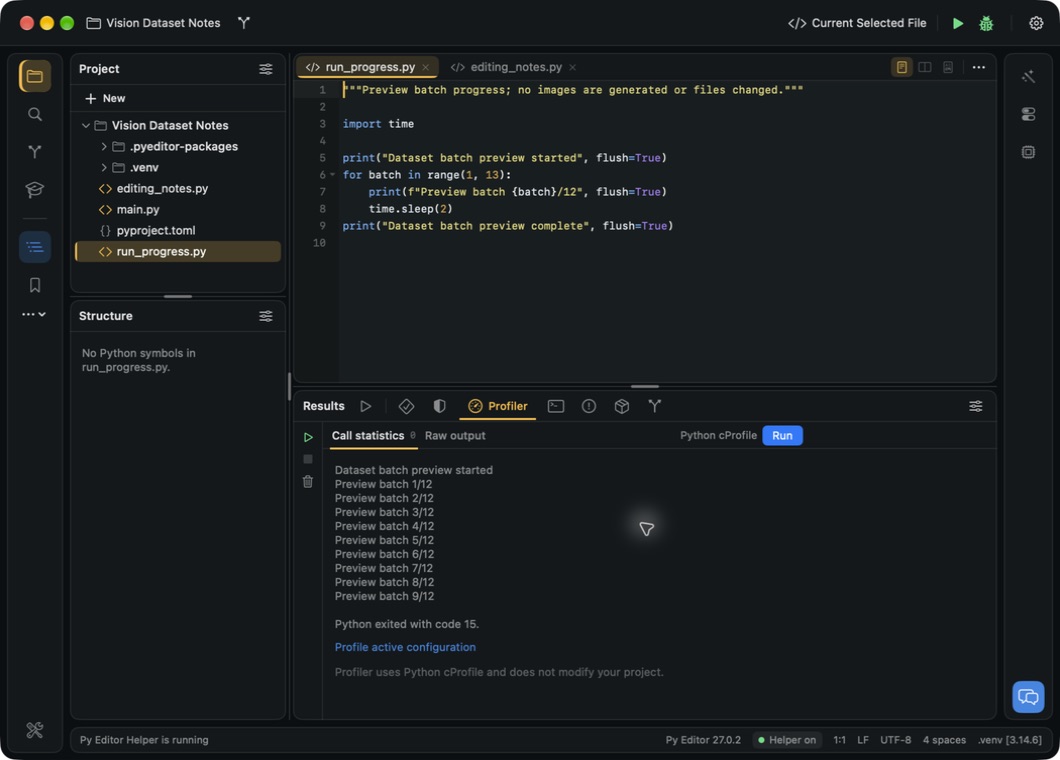
In this check, output ended at Preview batch 9/12, followed by Python exited with code 15. The script's final Dataset batch preview complete message was absent, and no completed call table appeared. Your stopping point may differ. Do not treat an interrupted session as a complete performance measurement.
To retry, click Run and leave the script running until it finishes. The reviewed retry produced all twelve messages and the completion line in Raw output, then showed 24.691 seconds and 439 calls in Call statistics. Those numbers describe this demonstration, including its deliberate pauses; they are not a performance target. Stop does not undo actions a different profiled program has already performed.
Clear the displayed profile
The trash-shaped Clear profiler results button clears the current report and its output. After using it on the completed review session, Call statistics returned to No profiling session yet and the duration/call summary disappeared. Raw output then showed The profiled program produced no output. In this case that message described the cleared view, not what the earlier run actually printed. Keep any measurements you need before clearing; this control is not a way to undo the program's actions or its generated report file.
Read a static-analysis diagnostic
Problems checks the source without requiring a failing test. On the reviewed AI example, the test and training run succeeded while Pyright still reported two type diagnostics. These checks answer different questions.
- Open Problems, the exclamation-mark tool in Results.
- If the project has not been analyzed, click Analyze Now.
- Wait for the analyzer to finish.
- Expand a file's diagnostic group if needed.
- Click a diagnostic to move the editor to the affected line.
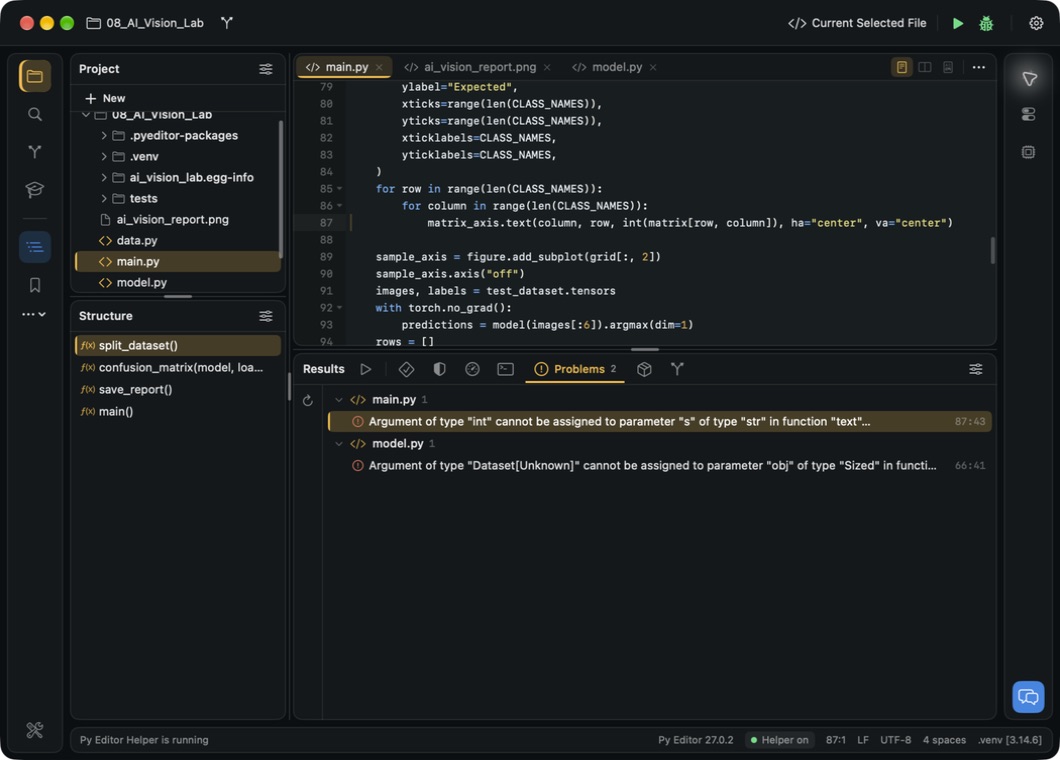 Open the screenshot to view it at full size.
The verified report identified main.py:87:43 (an integer supplied where the
Matplotlib text signature expects a string) and model.py:66:41 (the dataset type
not satisfying the checker's Sized protocol). Selecting the first entry moved
the source view to line 87; the status bar showed 87:1. The diagnostic's column
and the cursor's landing column are not the same thing in this observed flow.
On the first attempt, the panel reported Analysis failed with a Node setup message. Clicking Try Again after that setup completed produced the diagnostic list. This is the recovery observed on this Mac, not a promise that retry fixes every analyzer error. If retry fails again, keep the error text and check the project's Editor and interpreter settings.
No example source was changed to remove these diagnostics during documentation. The manual records the actual result rather than presenting the sample as warning- free. Reanalyse is available for checking again after you make a change.