Measure coverage and profile a program
Find out which lines your tests execute, and where a program spends its time.
Coverage and profiling answer different questions from a passing test: coverage counts executed statements, and the profiler measures calls and time.
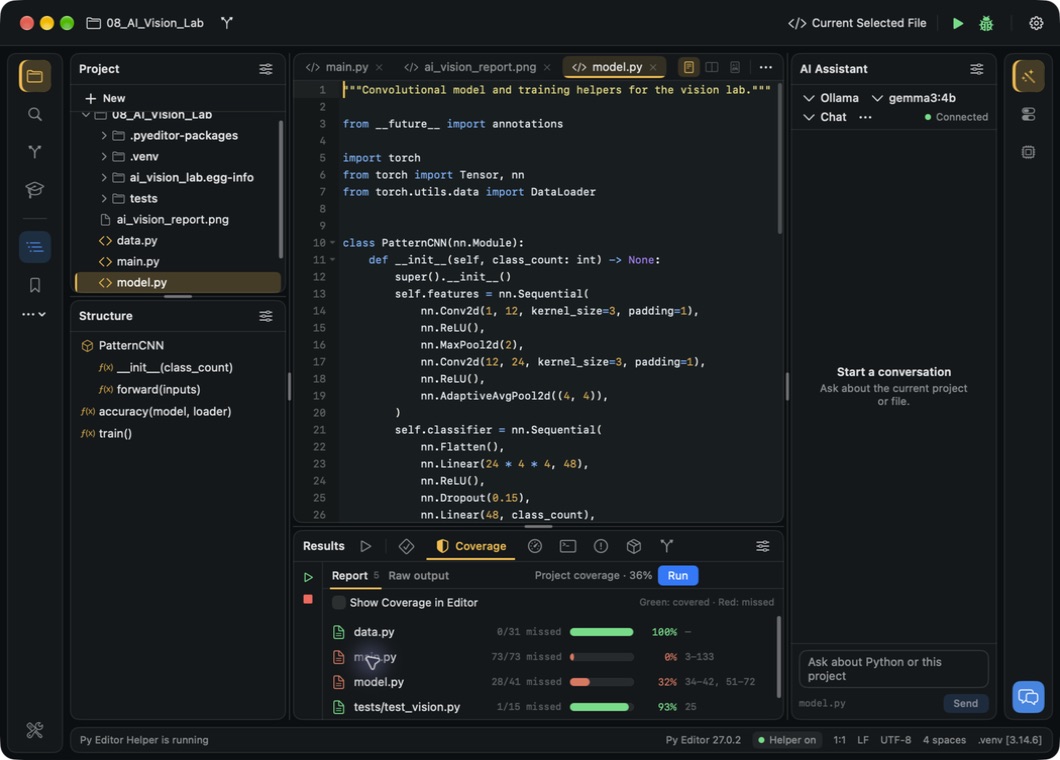
Measure test coverage
- Click Coverage in the Results dock.
- Click Run.
- Read the Report tab.
 Open the screenshot to view it at full size.
The report shows the project total and one row per file, each with its missed and total statements, a percentage and the line numbers that were not executed. Raw output shows the test run and the coverage table it produced.
Find code your tests did not execute
- On the Report tab, find a file with missed statements.
- Click its row. The editor opens that file at the first missing line.
- Read the surrounding function and decide which behavior a new test should cover.
- Run coverage again after changing tests or source.
Select Show Coverage in Editor to mark covered and missed lines in the editor; the colors are drawn only by the native editor engine.
A missed line is a line your tests never ran, not necessarily a defect.
Profile a program
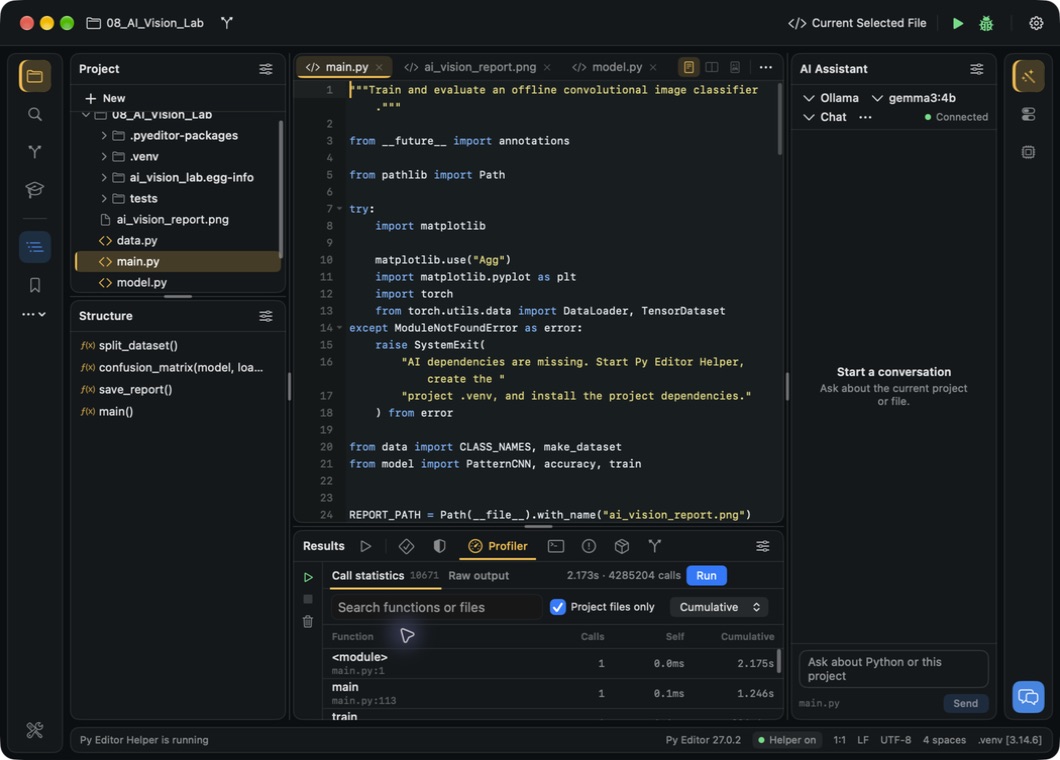
Profiling runs the configured program under Python's profiler, so the program still does everything it normally does, including writing files. Profiling needs Py Editor Helper.
- Select the script and check the run configuration in the toolbar.
- Open Profiler in the Results dock.
- Click Run.
- Wait for the Call statistics tab to fill.
 Open the screenshot to view it at full size.
| Column or control | How to use it |
|---|---|
| Function | The called function with its file and line. |
| Calls | How often the function was called. |
| Self | Time spent inside the function, excluding functions it called. |
| Cumulative | Time including the functions it called. |
| Search functions or files | Narrows the visible rows. |
| Sort | Cumulative, Self time or Calls, each largest first. |
| Raw output | The profiled program's own output. |
A high cumulative time shows where to look; it does not identify the cause. Compare equivalent runs before drawing a conclusion about an optimization.
Sort, filter and open a function
- Enter part of a name in Search functions or files to narrow the table.
- Choose Calls in Sort to find frequently called functions, or Self time to find the ones that are slow in themselves.
- Double-click a row that belongs to your project to open its source at that line.
- Clear the search field to show the whole table again.
Changing the search or the sort works on the profile you already have; you do not need to run the program again.
Stop or clear a profile
Click Stop while the profiler is running to end the session. A stopped session produces no call table, and stopping does not undo what the program already did.
Click Clear profiler results to empty the current report and its output. Keep any measurement you need first.