Debug a program
Pause a program at a chosen line, read its stack and values, and advance through it one statement at a time.
Debugging needs Helper.
Before you start
Save the file and check the run-configuration chip in the toolbar: the debugger uses the active run configuration, the same one Run uses. Debugging executes the program, so anything it writes to disk or sends over the network happens as it would in a normal run.
Set a breakpoint and start the debugger
- Select the Python file and put the cursor on the line where you want to pause.
- Choose Run → Toggle Breakpoint → Toggle Line Breakpoint, or click the editor's gutter beside the line number.
- Click Debug active configuration, the bug icon in the toolbar, or choose Run → Debug Current File (⌃D).
- Wait for Paused · ‹file›:‹line› in the Debug panel.
The Debug panel shows the paused location, the breakpoint count, and the Call Stack, Variables and Debug Console sections. Choosing Toggle Line Breakpoint on a line that already has a breakpoint removes it, so check the cursor's line first.
Read the stack and the values
Select an entry in Call Stack to see that frame. Variables then lists the names available in the selected frame, with their values.
Evaluate an expression
- Click in Evaluate expression while the program is paused.
- Enter the expression.
- Click Evaluate.
- Read the result in Debug Console.
Evaluating runs Python in the paused program, so use read-only expressions when you only want to inspect state.
Advance one statement
- Click Step over, the right-arrow control in the Debug gutter, or choose Run → Debugging Actions → Step Over (F8).
- Wait for the new Paused location.
- Compare the highlighted source line with the call stack.
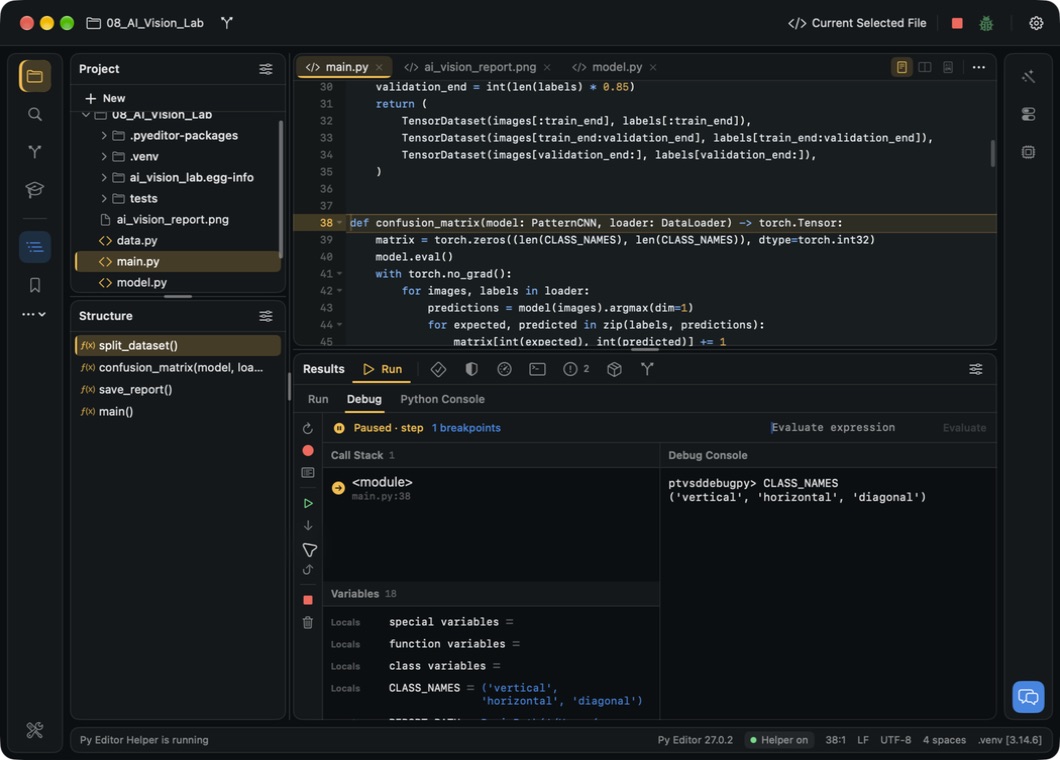 Open the screenshot to view it at full size.
A step follows executable statements, so it can skip blank lines, comments and the body of a function it does not enter.
Continue to the next breakpoint
- Click Continue, the triangle in the Debug gutter, or choose Run → Debugging Actions → Resume Program (⌃⌘R).
- Wait for the next breakpoint, or for the program to finish.
When the program finishes, the panel returns to Debugger ready.
Manage breakpoints without a running session
- Click Bookmarks in the left tool rail, or choose Run → Toggle Breakpoint → View Breakpoints… (⇧⌘F8).
- Put the cursor on the line you want and click Breakpoint in the panel header to add or remove a breakpoint there.
- Click a breakpoint row to open that file at its line.
- Click a row's × control to remove that breakpoint.
The Breakpoint button acts on the editor's cursor line, not on the selected row. Removing a breakpoint changes where the program pauses; it does not change the source.
Breakpoint conditions are available only in the native editor, where you right-click the ruler beside the line.
Restart or stop the debugger
- Click Start or restart debugger, the circular-arrow control, to end the current process and start a new one. Execution begins from the top of the program again, so code before your breakpoint runs a second time.
- Click Quit debugger, the square control, to end a paused session.
- Click Clear debugger output to empty Debug Console without ending the session.
After Quit debugger, the panel reports Debugger ready. Remove the breakpoints you added and keep the ones you still need.